Board offers a user-friendly drag-and-drop interface, a wide range of charts, and advanced MS Office® integration, along with alerting and broadcasting functions. This combination makes creating and distributing various types of reports easy across the organization. The self-service environment allows users to customize reports and obtain immediate answers, ensuring a consistent and shared information source.

Personalized, interactive reports.
Board enables the scheduling and automation of report delivery in any format to thousands of users, ensuring timely access to the right information. Using security roles, a single report can be distributed widely, with data visibility tailored to user authorizations. Multi-lingual capabilities allow information to be viewed in the user's preferred language.
Data discovery and enterprise reporting.
Self-service reporting in Board lets users customize reports using drag-and-drop measures and dimensions. The intuitive point-and-click interface allows users to use any Board object for analysis, managing filters, sorts, and alerts naturally.
Detailed analysis.


Event-driven reporting.
Alerting and broadcasting mechanisms connect information delivery to continuous business data monitoring. Decision-makers are notified immediately of important events, enhancing information delivery effectiveness and business responsiveness.
Build once, deploy everywhere.
With native HTML 5 technology and responsive design, reports can be built once and deployed on any device without coding.
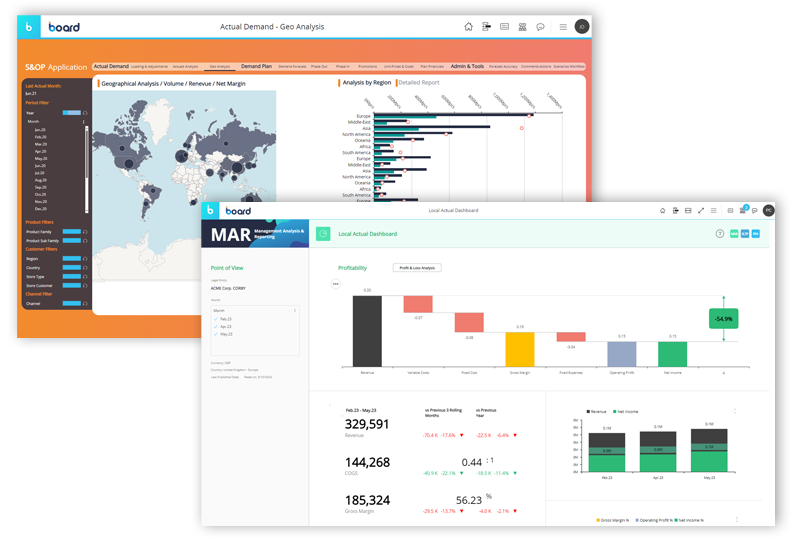
Advanced charting.
Board offers advanced charts like heat maps, tree maps, waterfall charts, bubble charts, and radars, providing appropriate visualization options for data analysis. Interactive maps further enable decision-makers to gain spatial insights from their data.